這原本是我三年前剛畢業的時候想要完成的計畫,但是一直都沒有時間完成。這次一來剛好利用這次要分析數據的機會,二來因為之前分析的數據實在太多了,多到我都記不得有寫過哪些程式,分析過哪些數據,所以藉此機會除了把它整合在一起外,順便將實驗室過去用到的數據整理起來。
檔案下載:請按此 (密碼:同影印機)
以下為使用教學,我知道整個介面很醜,但是我實在很不喜歡修飾,等有空我再來修飾,功能可以用比較重要吧!
首先要先建立一個資料夾,這個程式的階層是這樣的:一個主要資料夾(這邊我舉例的主資料夾名稱為整合計畫test,裡面一定要自己設定一個叫data的資料夾),然後把同樣一隻腳的測試資料丟到data資料夾,這個程式會自動去尋找主資料夾裡的data資料夾,讀裡面的資料
主資料夾
- data
- xxxx
- xxxx
- xxxx
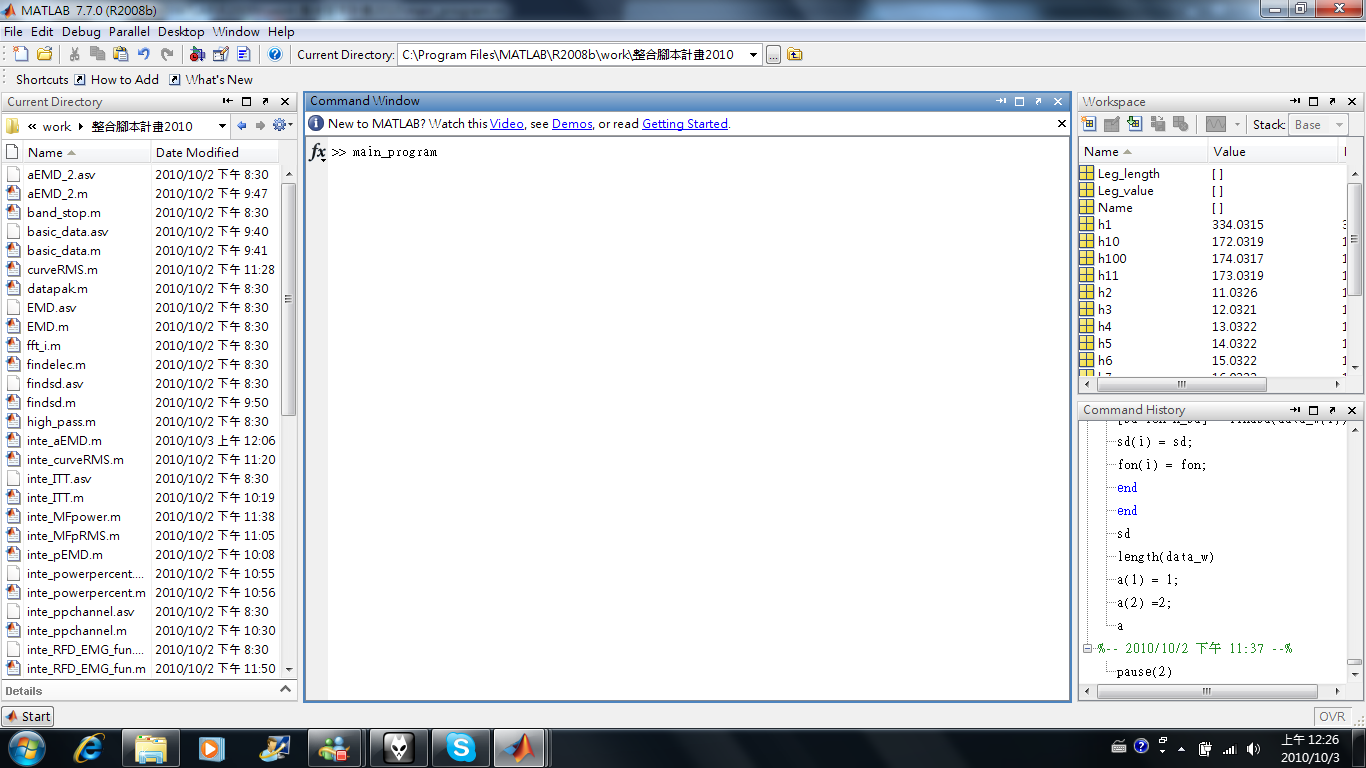
然後在matlab的command視窗打入main_program(記得上面的current directory要改成剛剛下載好的檔案存放的路徑)。
接下來就出現選單,可以選擇要計算的參數(還真多啊!)。
這裡我就示範全部勾選,一口氣用這兩筆做ITT的資料跑出全部數據!
接下來會出現一個視窗(我知道真的很醜!),可以填寫姓名,左右腳,以及腳長,主要是在最後輸出檔案的時候上面可以註明這個資料的主人,但是這僅限於第一次用,因為這邊的功能以及資料的寫入都是用附加的方式,所以只有在第一次跑的時候因為檔案尚未存在而會寫入這些基本資料(我知道我解釋的很難懂!)。
選擇剛剛自己建立的主資料夾(此例就是整合計畫test),不要選到data資料夾!!
因為有些計算須要用到force onset,但是依我算了不算多的數據經驗發現,論文裡面所寫的用兩倍標準差當作開始根本就是一個理想,像我現在的例子就可以看到這個受試者居然在用力那瞬間力量突然往下掉(可能想利用stretch-shortening cycle的方式看可不可以力量大一點,所以先勾了一下),或者有些受試者在喊預備的時候就在那邊偷偷用力準備(這些不測風雲有時難以預測,有時候都不是當下可以發現到),所以這邊提供了輸了標準差的方式。
因為計算RFD以及RER須要換算成torque,所以都有勾選要計算這兩個參數的時候,就會出現要求輸入腳踝的長度(力臂)。
如果計算active EMD的話,會強迫重新輸入SD,至於原因則是不能說的秘密!
中間會出現一大堆運算後的圖片,這些都可以在之後主資料夾裡面找到(圖中為,百分比MVC對於時間的變化率)。
如果有勾選curveRMS這個參數(主要是計算不同百分比MVC下,EMG RMS對時間變化的斜率),會發現突然停頓,這是因為計算RMS所需的時間較長。
這邊也會要求輸入RMS EMG的SD,原因跟force一樣。
劈哩啪啦跑完之後,可以發現主資料夾多了很多資料夾,以及有一個叫做result.txt的檔案。
我們用一些文字編輯器或是notepad打開可以看到我們剛剛算的數據。
由於文字編輯器對於換格tab會因為字串長度不同可能無法對齊,導致看起來不是那麼好看,所以我們改用excel開啟看看。
由excel開啟之後,可以發現每個data都排排站站好。
而且每個參數都會把每次trial所計算的記錄下來(如果今天發生某次trial的值過於偏差,可以在此修改),以及這些trial的平均(有幾個檔案就用幾個平均,兩個檔案就兩個平均,三個就三個平均,一個當然就一個自己平均啦!真是太神奇啦!)!
然後我們打開資料夾看看,這邊是打開ITT資料夾,就可以看到這次所算的ITT圖以及結果。
當然如果要重算某樣參數也是可以,在不刪除result.txt的情況下,會自動把新算的數據直接附加到原來數據的最後,而資料夾裡面的圖片也自動被新的附蓋過去。當然如果想要重新跑的話,就把result.txt砍了就行了!
後記:
1. 這次的整合程式,主要的應用在我們做ITT的trial上面,也就是每次我都會跟受試者說要被電三次,我想如果都是照著這樣既定的protocol做的話,程式大多應該不會出現問題。
2. 我將原始檔案附在上面,希望大家使用上如果發生問題可以告知我(至少目前我的幾筆資料都是沒有問題),大家的反應才是可以把這個程式修改到好的原動力。
3. 這次有些程式我有改寫(變得比較精簡),然後整合程式撰寫我也是力求工整,這樣也比較利於之後如果有人想要增加新功能,新參數使用。
4. 有時間的話我再把他外觀弄得好看一點。
5. 最後,我該睡了!!
Recently, I have upgraded almost my computers to windows 7 except the computer in my lab. Yesterday, I installed matlab 7.1 on my desktop and found out some errors when running the program, even using the comparable mode provided by windows 7. So I find the solution on the internet and here is the solution.
The original article is from this: How To Run Matlab 7.1 On Windows 7
Instructions
- Right Click On Desktop, choose Personalize
- Got to Basic and High Contrast Themes tab, and click Window Classic
- Now, Run matlab
- Finish
So, if you want to use matlab 7.1 on windows 7, you need to accept the ugly theme when running matlab program. It's also a little bit inconvenient because you have to switch the theme when running Matlab.
Yesterday night, one of junior classmates told me that he found a useful function called "ginput" which can make the thing getting mouse position easier than using "get(gca......)". It's very convenient when designing some program such as calculating angle in coordinate plane. So, here is a very simple example about how to calculate the angle in a certain image.
Try it, it's very funny!!!
global flag h_im h_1
filename='D:\07020203_mpg2-0000281.jpg';
im=imread(filename);
h_im=image(im);
while 1
cal_cord_ang;
end
function cal_cord_angHowever, I almost forget the concept of vector, even the product of two vectors. You can review the concept in this url: http://www.euclideanspace.com/maths/algebra/vectors/angleBetween/index.htm.
global flag h_im h_1
cla(h_im)
[x,y] = ginput(1);
a=[x,y];
x0=a(1,1);
y0=a(1,2);
hold on
h_1=plot(x0,y0,'color','r','marker','+');
[x,y] = ginput(1);
b=[x,y];
x1=b(1,1);
y1=b(1,2);
h_1=plot([x0 x1],[y0 y1],'color','r','marker','+');
[x,y] = ginput(1);
c=[x,y];
x2=c(1,1);
y2=c(1,2);
h_1=plot([x0 x1 x2],[y0 y1 y2],'color','r','marker','+');
% calculate angle by using this formula --> A dot B = ABcos
A=a-b;
B=c-b;
angle=acosd(dot(A,B)/(norm(A)*norm(B)));
x_t=mean([x0 x2]);
y_t=mean([y0 y2]);
text(x_t,y_t,num2str(angle),'color','r')
ginput(1)
cla(h_im)
Try it, it's very funny!!!
This article, 35 Complete GUI Examples, gives examples about GUI that I found today. It contains several questions that many people usually ask and also attaches the example codes. It is very useful reference when designing a GUI program.
Here is the description of this article:
The questions/files are written in approximate order of complexity, so intermediate users may want to skip the first several files.
The questions answered include:
1. How do I manipulate the strings in a uicontrol?
2. How do make a uicontrol invisible/visible?
3. How do I make a multi-line editbox?
4. How can I let the user of my GUI know his actions are futile (or producing no results)?
5. How can I tell which uicontrol is selected?
6. How can I tell how many times a uicontrol has been activated?
7. How do I tell which button in a buttongroup is selected?
8. How do I let the user know a process is running in the background?
9. How do I control the mouse pointer with a GUI?
10. How can I access the value (current position) of a slider?
11. How can I use different colored strings in a listbox?
12. What is the difference between 'listboxtop' and 'value' in a listbox?
13. How can I make text that can be copied but not changed?
14. How do I allow the user of my GUI to set the range of a slider?
15. How do I use the buttondownfcn on an axes object?
16. How do I make a callback talk to another callback?
17. How can I get the string from a popup or listbox?
18. How can I set the string in a popup or listbox?
19. How can I add to the string in a popup or listbox?
20. How do I tell which figure was current before my callback executed?
21. How do I get data from another GUI?
22. How do I make a GUI to open image files only?
23. How can I make popup choices mutually exclusive?
24. How can I show the current pointer location in axes coordinates?
25. How can I use uicontextmenus?
26. How do I make my GUI control an axes in another figure?
27. What are callback strings?
28. How can I make it so that when one of the figures closes, they all close?
29. How do I make several uicontrols interact in a more complicated GUI?
30. How do I get data from a GUI to the base workspace?
31. How do I make toggle buttons act like tabbed-panels?
32. How can I make a password editbox that has the ***** symbols?
33. How can I use nested function as callbacks?
34. How can I use uiwait in a GUI?
35. How do I use JAVA in my GUI?
36. How do I force the figure to maintain focus between uicontrol activations?
37. How do I save an axes as an image?
38. How can I make a simple drawing program?
39. How can I save the state of a system of GUIs to use later?
2. How do make a uicontrol invisible/visible?
3. How do I make a multi-line editbox?
4. How can I let the user of my GUI know his actions are futile (or producing no results)?
5. How can I tell which uicontrol is selected?
6. How can I tell how many times a uicontrol has been activated?
7. How do I tell which button in a buttongroup is selected?
8. How do I let the user know a process is running in the background?
9. How do I control the mouse pointer with a GUI?
10. How can I access the value (current position) of a slider?
11. How can I use different colored strings in a listbox?
12. What is the difference between 'listboxtop' and 'value' in a listbox?
13. How can I make text that can be copied but not changed?
14. How do I allow the user of my GUI to set the range of a slider?
15. How do I use the buttondownfcn on an axes object?
16. How do I make a callback talk to another callback?
17. How can I get the string from a popup or listbox?
18. How can I set the string in a popup or listbox?
19. How can I add to the string in a popup or listbox?
20. How do I tell which figure was current before my callback executed?
21. How do I get data from another GUI?
22. How do I make a GUI to open image files only?
23. How can I make popup choices mutually exclusive?
24. How can I show the current pointer location in axes coordinates?
25. How can I use uicontextmenus?
26. How do I make my GUI control an axes in another figure?
27. What are callback strings?
28. How can I make it so that when one of the figures closes, they all close?
29. How do I make several uicontrols interact in a more complicated GUI?
30. How do I get data from a GUI to the base workspace?
31. How do I make toggle buttons act like tabbed-panels?
32. How can I make a password editbox that has the ***** symbols?
33. How can I use nested function as callbacks?
34. How can I use uiwait in a GUI?
35. How do I use JAVA in my GUI?
36. How do I force the figure to maintain focus between uicontrol activations?
37. How do I save an axes as an image?
38. How can I make a simple drawing program?
39. How can I save the state of a system of GUIs to use later?
I am open to hearing any suggestion as to other questions which could be covered in the collection. Such suggestions need not be basic. Please read the pdf file prior to use. Also the contents.m file contains brief descriptions of each GUI.
Please email me if an error is found, either in the documentation or coding. Thanks.
In my Sonoanalysis program, I need to mark the position I want on the sono image. Before I read this article: Superimposing line plots on image, there are two ways I thought to achieve this task. One is using plot function, and the other is changing the color of the pixel of position I click. However, the later method has a critical problem that it may be a time wasting method if I want to mark the position repeatedly, because I have to change several pixels if the shape of the marker is cross or circle. As a result of that, I choose the first way to accomplish my task finally. Today, I surfed on the internet to seek the correct method to do this kind of thing.
In this article: Superimposing line plots on image, the author who manages the Image & Geospatial development team at the Mathworks shows the way by using plot function, so I think it is a better way to do this task.
今天為了讓別台電腦也能夠跑Matlab程式,到處搜尋,最後在PTT Matlab版上找到了辦法:
如何將GUI轉成執行檔EXE,在未安裝MATLAB之電腦執行?
首先須先有以經做好的gui.m文件和gui.fig文件:
1.在matlab的command窗口中輸入 mcc -B sgl GUI.m
2.將上步生成的文件連同GUI.m文件和GUI.fig文件一起COPY到執行的電腦上(未安裝MATLAB的電腦),並放置在同一個資料夾下。
3.再去\toolbox\compiler\deploy\win32目錄下面找 MCRinstaller.exe 這個檔案(約102MB),複製到(別殺掉此檔!!)要執行的電腦上安裝。
4.安裝後即可編譯GUI.exe。^^
以上為最近使用心得.....提供給大家參考~~~祝大家玩個愉快....
前言:改良自碩士班的原始版本,當初懵懵懂懂寫得很亂,現在以新觀念方法改造。

- Load File:開啟後選取圖片資料夾,資料夾內圖片會以[sort_name] = sort_file(path)排列,目的是將連續圖片排序,若是一般則以sort的方式(排列字母大小等)。但是當初因為自己的失誤把檔名寫成1.jpg, 2.jpg ….. 10.jpg, 11.jpg…..,經過排列後會變成1.jpg, 10.jpg, 11.jpg, ……, 19.jpg, 2.jpg, 21.jpg…..,因此才多寫若是檔名不一樣長,則以不同cell的方式將相同長度檔名放入排列(目前只有到十位數)。
- Sliderbar:會將sort過得file按照順序排列,提供一張張點選。
- position select:則是以sono_mousedown.m方式,將滑鼠點所點的點的座標顯示。
- Dist tool:以matlab內建的dist tool作用,不過目前沒有校正顯示的長度。
- Save Figure & value:將座標值存入table中,並且將點選好的圖片存入目前資料夾內,並且以[path new_filename] = changefilename(filename,add_word)改名(如:a_原始檔名)。改名之後,由於儲存圖檔的時候當初以plot方式所畫得十字記號無法存入,因此以[change_image] = draw_image(im,x,y)方式,將所選取的座標位置上下左右15個像素統統改成紅色(即變成十字)。
匯入座標資料於table,並且[cal_dist]=calcu_dist(ini_p,cal_p,dist_prop),依目前深度計算和第一點的距離。 - Export:將資料匯出,內建以目前資料夾為匯出處,以[file,path]=uiputfile('.txt','Save file as',eval('[handles.path default_file]'))完成想要匯出的資料夾,預設以dist.txt作為預設匯出檔名。
匯出後以sonofilemerge(path,sonofile,distfile)自動和sono.txt檔案結合成stiff.txt(個人需要)。
這個東西我實在沒有時間好好的把他製作一番。
electroGUI V.0.0001(毫無意義版)界面介紹


若是資料選取順序錯誤,則會出現警告。

結論:
目前版本非常陽春而且bugs很多,待我有空有時間,在陸續修正並增加新功能,不過對於計算peak to peak amplitude目前來說應已經足夠。
electroGUI V.0.0001(毫無意義版)界面介紹

- 開啟(以autochoosetype.m):目前內建可讀全部為數據的txt檔(以textread開啟),InstruNet(以readintranet.m開啟)所產生的.TXT檔(如:Ch1_Vin+.TXT),以及一般具有標頭檔案(以hdrload.m開啟)。
- 資料數據(以datacursor):則是可以點選圖形,顯示原始x,y資料點,如下圖:

- 選取範圍(以get_x_point.m):即點選圖形區域,目前規定要由左到右選取。如下圖:點選後按peak to peak即以所填入的放大倍率計算peak to peak amplitude。

若是資料選取順序錯誤,則會出現警告。

結論:
目前版本非常陽春而且bugs很多,待我有空有時間,在陸續修正並增加新功能,不過對於計算peak to peak amplitude目前來說應已經足夠。
這個影片介紹了如何在GUIDE中,建立互相獨立的radio button,說真的,我是今天才找到這個資料,之前也是百思不得其解,好在youtube有人分享。
不過,因為這個不是英文也不是中文,所以應該聽不懂他在說啥,但是就算不聽看操作步驟也應該是可以懂得!
今天我有一個檔案長得如下:
在matlab裡面一定沒有辦法用既有的textread讀取,因為第一行的文字!於是我寫個個跳過第一行的程式!如下:
概念很簡單,就是輸入要跳過的行數,然後以行數來計算一行一行存成矩陣!但是這時候我又想到,剛好今天我這個檔案非常的小,行數也很短,如果我今天拿上萬行的數據執行,執行到死都執行不完!。
百思不得其解後,google了許久,在matlab官方網站看到了有人分享的寫法:
簡單的說,這個程式先一行一行判斷是否為string(if ~isstr(line)),然後在以data = [data; fscanf(fid, '%f')];讀入數值資料,並且會以[data, ncols, errmsg, nxtindex] = sscanf(line, '%f');(其中line是先讀入一行)去看ncols。
最後再把讀入的數值data資料用reshape的方式(data = reshape(data, ncols, length(data)/ncols);)完成。速率的確加快許多。
frame force angle
180.000000 25.907727 -96.707100
198.000000 52.657283 -97.686900
206.000000 79.306087 -97.134200
216.000000 105.920720 -96.028800
234.000000 132.531830 -95.501200
252.000000 159.259191 -95.023900
271.000000 185.936060 -94.496300
293.000000 212.583572 -94.194800
312.000000 239.251047 -92.586900
332.000000 265.956685 -91.506600
357.000000 292.655864 -91.556900
364.000000 265.886229 -91.255400
369.000000 239.255744 -91.582000
376.000000 212.594141 -92.813000
384.000000 185.939583 -92.586900
394.000000 159.297355 -93.215000
406.000000 132.574103 -93.390900
421.000000 105.981781 -93.943600
434.000000 79.340140 -94.747500
468.000000 52.674016 -96.104100
501.000000 25.987401 -97.360300
在matlab裡面一定沒有辦法用既有的textread讀取,因為第一行的文字!於是我寫個個跳過第一行的程式!如下:
function mat_a = get_to_mat(filename,l)
fp = fopen(filename);
current_l = 1;
while 1
content = fgetl(fp);
if current_l <= l
tile = content;
current_l = current_l +1;
elseif current_l > l & ischar(content) == 1
mat_a(current_l - l,:) = str2num(content);
current_l = current_l +1;
elseif ischar(content) == 0
break
end
end
fclose(fp);;
概念很簡單,就是輸入要跳過的行數,然後以行數來計算一行一行存成矩陣!但是這時候我又想到,剛好今天我這個檔案非常的小,行數也很短,如果我今天拿上萬行的數據執行,執行到死都執行不完!。
百思不得其解後,google了許久,在matlab官方網站看到了有人分享的寫法:
function [header, data] = hdrload(file)
% HDRLOAD Load data from an ASCII file containing a text header.
% [header, data] = HDRLOAD('filename.ext') reads a data file
% called 'filename.ext', which contains a text header. There
% is no default extension; any extensions must be explicitly
% supplied.
%
% The first output, HEADER, is the header information,
% returned as a text array.
% The second output, DATA, is the data matrix. This data
% matrix has the same dimensions as the data in the file, one
% row per line of ASCII data in the file. If the data is not
% regularly spaced (i.e., each line of ASCII data does not
% contain the same number of points), the data is returned as
% a column vector.
%
% Limitations: No line of the text header can begin with
% a number. Only one header and data set will be read,
% and the header must come before the data.
%
% See also LOAD, SAVE, SPCONVERT, FSCANF, FPRINTF, STR2MAT.
% See also the IOFUN directory.
% check number and type of arguments
if nargin < 1
error('Function requires one input argument');
elseif ~isstr(file)
error('Input must be a string representing a filename');
end
% Open the file. If this returns a -1, we did not open the file
% successfully.
fid = fopen(file);
if fid==-1
error('File not found or permission denied');
end
% Initialize loop variables
% We store the number of lines in the header, and the maximum
% length of any one line in the header. These are used later
% in assigning the 'header' output variable.
no_lines = 0;
max_line = 0;
% We also store the number of columns in the data we read. This
% way we can compute the size of the output based on the number
% of columns and the total number of data points.
ncols = 0;
% Finally, we initialize the data to [].
data = [];
% Start processing.
line = fgetl(fid);
if ~isstr(line)
disp('Warning: file contains no header and no data')
end;
[data, ncols, errmsg, nxtindex] = sscanf(line, '%f');
% One slight problem, pointed out by Peter vanderWal: If the
% first character of the line is 'e', then this will scan as
% 0.00e+00. We can trap this case specifically by using the
% 'next index' output: in the case of a stripped 'e' the next
% index is one, indicating zero characters read. See the help
% entry for 'sscanf' for more information on this output
% parameter. We loop through the file one line at a time until
% we find some data. After that point we stop checking for
% header information. This part of the program takes most of the
% processing time, because fgetl is relatively slow (compared to
% fscanf, which we will use later).
while isempty(data)|(nxtindex==1)
no_lines = no_lines+1;
max_line = max([max_line, length(line)]);
% Create unique variable to hold this line of text information.
% Store the last-read line in this variable.
eval(['line', num2str(no_lines), '=line;']);
line = fgetl(fid);
if ~isstr(line)
disp('Warning: file contains no data')
break
end;
[data, ncols, errmsg, nxtindex] = sscanf(line, '%f');
end % while
% Now that we have read in the first line of data, we can skip
% the processing that stores header information, and just read
% in the rest of the data.
data = [data; fscanf(fid, '%f')];
fclose(fid);
% Create header output from line information. The number of lines
% and the maximum line length are stored explicitly, and each
% line is stored in a unique variable using the 'eval' statement
% within the loop. Note that, if we knew a priori that the
% headers were 10 lines or less, we could use the STR2MAT
% function and save some work. First, initialize the header to an
% array of spaces.
header = setstr(' '*ones(no_lines, max_line));
for i = 1:no_lines
varname = ['line' num2str(i)];
% Note that we only assign this line variable to a subset of
% this row of the header array. We thus ensure that the matrix
% sizes in the assignment are equal. We also consider blank
% header lines using the following IF statement.
if eval(['length(' varname ')~=0'])
eval(['header(i, 1:length(' varname ')) = ' varname ';']);
end
end % for
% Resize output data, based on the number of columns (as returned
% from the sscanf of the first line of data) and the total number
% of data elements. Since the data was read in row-wise, and
% MATLAB stores data in columnwise format, we have to reverse the
% size arguments and then transpose the data. If we read in
% irregularly spaced data, then the division we are about to do
% will not work. Therefore, we will trap the error with an EVAL
% call; if the reshape fails, we will just return the data as is.
eval('data = reshape(data, ncols, length(data)/ncols)'';', '');
簡單的說,這個程式先一行一行判斷是否為string(if ~isstr(line)),然後在以data = [data; fscanf(fid, '%f')];讀入數值資料,並且會以[data, ncols, errmsg, nxtindex] = sscanf(line, '%f');(其中line是先讀入一行)去看ncols。
最後再把讀入的數值data資料用reshape的方式(data = reshape(data, ncols, length(data)/ncols);)完成。速率的確加快許多。
如題,最近在研究FreeMat和Scilab兩個免費又和matlab相似的軟體(應該說是clone)
matlab中的textread對於我讀大量數據的時候非常方便,自動可以存成矩陣,剛剛google了一下,發現scilab中的fscanfMat指令有相同功能。
不過現在美中不足的是,scilab介面改由java製成,plot指令居然會造成crash,哇哩勒!連plot都不能用那還搞啥東東!?於是只好將回version4使用!(難怪下載的時候發現scilab怎麼變得如此肥!)
matlab中的textread對於我讀大量數據的時候非常方便,自動可以存成矩陣,剛剛google了一下,發現scilab中的fscanfMat指令有相同功能。
不過現在美中不足的是,scilab介面改由java製成,plot指令居然會造成crash,哇哩勒!連plot都不能用那還搞啥東東!?於是只好將回version4使用!(難怪下載的時候發現scilab怎麼變得如此肥!)
今天試圖來做一個檔案處理,預備將我要的檔案形式讀入,我的檔案很簡單,如下:
這是在記事本或是notepad顯示的資料,前面是姓名並且腿長和腳踝長中間以'\t'做區隔。
我的目的是要將檔案如matlab中textread指令一樣,將資料讀入並以name Leg Ankle,三個陣列儲存,然後第一行不要。
想法非常簡單m=1單純就用在第一行,然後把第一行資料丟到title裡面去。其他就是[name(n) Leg(n) Ankle(n)]=strread(content,'%s %f %f');依照這樣格式丟入,然後如果讀到最後一行fgets(fd) == -1,則結束此程式。
執行後結果,以name來看
哇哩勒,what happened??為啥麼只讀了3 5 7 9 11 13行,發生了啥事?百思不得其解,試了又試,情況依舊,於是我開始懷疑起elseif fgets(fd) == -1,所以我把程式改寫成
果不其然,這次完全沒有問題
那也就是說,把elseif fgets(fd) == -1當作判斷句的時候,程式就會讀了一行,所以在跑之後的[name(n) Leg(n) Ankle(n)]=strread(content,'%s %f %f'),所讀到的就是下一行檔案內的東西!
name 腿長 腳踝長
SYC 47 19
YFT 41 13
ZJY 45 15
LSP 44 14
CCH 51 16
LIU 42 14.5
KMY 40 14
LC 41 13.5
LGP 46 15
CCL 40 13.5
CIC 49 16
ZKY 48 15
這是在記事本或是notepad顯示的資料,前面是姓名並且腿長和腳踝長中間以'\t'做區隔。
我的目的是要將檔案如matlab中textread指令一樣,將資料讀入並以name Leg Ankle,三個陣列儲存,然後第一行不要。
clear all
fd = fopen('I:\Leglength.txt','r');
m = 1;
n = 1;
while 1
if m == 1
tile = fgets(fd);
m=m+1;
elseif fgets(fd) == -1
break
else
content=fgets(fd);
[name(n) Leg(n) Ankle(n)]=strread(content,'%s %f %f');
n=n+1;
end
end
fclose(fd);
想法非常簡單m=1單純就用在第一行,然後把第一行資料丟到title裡面去。其他就是[name(n) Leg(n) Ankle(n)]=strread(content,'%s %f %f');依照這樣格式丟入,然後如果讀到最後一行fgets(fd) == -1,則結束此程式。
執行後結果,以name來看
>> name
name =
'YFT' 'LSP' 'LIU' 'LC' 'CCL' 'ZKY'
哇哩勒,what happened??為啥麼只讀了3 5 7 9 11 13行,發生了啥事?百思不得其解,試了又試,情況依舊,於是我開始懷疑起elseif fgets(fd) == -1,所以我把程式改寫成
clear all
fd = fopen('I:\Leglength.txt','r');
m = 1;
n = 1;
while 1
content = fgets(fd)
if m == 1
tile = content;
m=m+1
elseif ischar(content) == 1
[name(n) Leg(n) Ankle(n)]=strread(content,'%s %f %f');
n=n+1;
end
if content == -1
break
end
end
fclose(fd);
果不其然,這次完全沒有問題
>> name
name =
'SYC' 'YFT' 'ZJY' 'LSP' 'CCH' 'LIU' 'KMY' 'LC' 'LGP' 'CCL' 'CIC' 'ZKY'
那也就是說,把elseif fgets(fd) == -1當作判斷句的時候,程式就會讀了一行,所以在跑之後的[name(n) Leg(n) Ankle(n)]=strread(content,'%s %f %f'),所讀到的就是下一行檔案內的東西!
首先先了解範例一的程式碼
主要的元件要有:
Static text:"請輸入繪圖指令:"
Pop-up Menu:'plot(x) | pie(x) | hist(y) | ezplot3(f) | polar(theta,r) | area(x,y)'
Pushbutton:開啟
axes:繪圖
然後最後還要有Menu bar的一個item
file:裡面含有:open close print三個元件
所以原本用guide方式設計的為請按此連結或是直接連到範例一
執行後畫面如下:

以及

open:開一個新的figure
close:關掉此figure並且會跳出視窗問是否確定要關掉
print:開啟印表機並且選擇列印這一個figure
若是以handle的方式執行的話,我將元件以structure的方式放入一個變數c
並且要將此變數定為global,如此才能在不同的callback中呼叫,並且利用
structure的方式,只要寫global c就可以了,不用在一個一個呼叫比較方便
所以主要的元件如下:
% Use uicontrol to create a GUI
%------------------------------------------------------------------------%
% Create and then hide the GUI as it is being constructed.
global c
c.f = figure('Visible','on','Position',[360,500,450,285]);
%------------------------------------------------------------------------%
% Construct the components
% component is constructed by structure of c.xxx
c.static=uicontrol('Style','text','Position',[60 230 100 20]);
c.popup=uicontrol('Style','popup','Position',[200 230 100 20]);
c.push=uicontrol('Style','pushbutton','Position',[320 230 50 20]);
c.axes=axes('Units','Pixels','Position',[30,30,400,185]);
c.filemenu=uimenu('Label','File');
c.openMenuItem=uimenu(c.filemenu,'Label','Open');
c.closeMenuItem=uimenu(c.filemenu,'Label','Close');
c.printMenuItem=uimenu(c.filemenu,'Label','Print');
% setup the UI
set(c.static,'String','請輸入繪圖指令:');
set(c.popup,'String','plot(x) | pie(x) | hist(y) | ezplot3(f) | polar(theta,r) | area(x,y)');
set(c.push,'String','開啟','callback',(@push_callback));
set(c.openMenuItem,'callback',(@OpenMenuItem_callback));
set(c.closeMenuItem,'callback',(@CloseMenuItem_callback));
set(c.printMenuItem,'callback',(@PrintMenuItem_callback));
將每一個元件都定義後,在將其特性以及相對應的callback寫好
程式碼如下:(或是直接按此連結)
執行結果如下:

以及
主要的元件要有:
Static text:"請輸入繪圖指令:"
Pop-up Menu:'plot(x) | pie(x) | hist(y) | ezplot3(f) | polar(theta,r) | area(x,y)'
Pushbutton:開啟
axes:繪圖
然後最後還要有Menu bar的一個item
file:裡面含有:open close print三個元件
所以原本用guide方式設計的為請按此連結或是直接連到範例一
執行後畫面如下:
以及
open:開一個新的figure
close:關掉此figure並且會跳出視窗問是否確定要關掉
print:開啟印表機並且選擇列印這一個figure
若是以handle的方式執行的話,我將元件以structure的方式放入一個變數c
並且要將此變數定為global,如此才能在不同的callback中呼叫,並且利用
structure的方式,只要寫global c就可以了,不用在一個一個呼叫比較方便
所以主要的元件如下:
% Use uicontrol to create a GUI
%------------------------------------------------------------------------%
% Create and then hide the GUI as it is being constructed.
global c
c.f = figure('Visible','on','Position',[360,500,450,285]);
%------------------------------------------------------------------------%
% Construct the components
% component is constructed by structure of c.xxx
c.static=uicontrol('Style','text','Position',[60 230 100 20]);
c.popup=uicontrol('Style','popup','Position',[200 230 100 20]);
c.push=uicontrol('Style','pushbutton','Position',[320 230 50 20]);
c.axes=axes('Units','Pixels','Position',[30,30,400,185]);
c.filemenu=uimenu('Label','File');
c.openMenuItem=uimenu(c.filemenu,'Label','Open');
c.closeMenuItem=uimenu(c.filemenu,'Label','Close');
c.printMenuItem=uimenu(c.filemenu,'Label','Print');
% setup the UI
set(c.static,'String','請輸入繪圖指令:');
set(c.popup,'String','plot(x) | pie(x) | hist(y) | ezplot3(f) | polar(theta,r) | area(x,y)');
set(c.push,'String','開啟','callback',(@push_callback));
set(c.openMenuItem,'callback',(@OpenMenuItem_callback));
set(c.closeMenuItem,'callback',(@CloseMenuItem_callback));
set(c.printMenuItem,'callback',(@PrintMenuItem_callback));
將每一個元件都定義後,在將其特性以及相對應的callback寫好
程式碼如下:(或是直接按此連結)
function demo3_GUI
% Use uicontrol to create a GUI
%------------------------------------------------------------------------%
% Create and then hide the GUI as it is being constructed.
global c
c.f = figure('Visible','on','Position',[360,500,450,285]);
%------------------------------------------------------------------------%
% Construct the components
% component is constructed by structure of c.xxx
c.static=uicontrol('Style','text','Position',[60 230 100 20]);
c.popup=uicontrol('Style','popup','Position',[200 230 100 20]);
c.push=uicontrol('Style','pushbutton','Position',[320 230 50 20]);
c.axes=axes('Units','Pixels','Position',[30,30,400,185]);
c.filemenu=uimenu('Label','File');
c.openMenuItem=uimenu(c.filemenu,'Label','Open');
c.closeMenuItem=uimenu(c.filemenu,'Label','Close');
c.printMenuItem=uimenu(c.filemenu,'Label','Print');
% setup the UI
set(c.static,'String','請輸入繪圖指令:');
set(c.popup,'String','plot(x) | pie(x) | hist(y) | ezplot3(f) | polar(theta,r) | area(x,y)');
set(c.push,'String','開啟','callback',(@push_callback));
set(c.openMenuItem,'callback',(@OpenMenuItem_callback));
set(c.closeMenuItem,'callback',(@CloseMenuItem_callback));
set(c.printMenuItem,'callback',(@PrintMenuItem_callback));
%------------------------------------------------------------------------%
% Initialize the GUI.
% Change units to normalized so components resize
% automatically.
set([c.f,c.static,c.popup,c.push],'Units','normalized');
%Create a plot in the axes.
c.axes=plot(rand(5));
% Assign the GUI a name to appear in the window title.
set(c.f,'Name','demo3 GUI')
% Move the GUI to the center of the screen.
movegui(c.f,'center')
%------------------------------------------------------------------------%
% Setup the callback function of all compoment
%----------------------------------%
%---------popup_callback-----------%
%----------------------------------%
function push_callback(source,eventdata)
global c
k=get(c.popup,'value');
switch k
case 1
plot(rand(5));
case 2
n=round(10*rand)+10;
pie(2:4:n);
case 3
hist(randn(1000,1));
case 4
ezplot3('t*sin(t)', 'cos(t)', 't', [0,6*pi])
case 5
theta = linspace(0, 2*pi);
polar(theta, 3+2*rand*cos(4*theta));
case 6
y=[1 1.2 1.5 2*rand;4 4.5 6.6 7*rand;5 6.5 8 15*rand]';
area([1980 1990 2000 2008],y);
grid on;colormap cool;
end
% --------------------------------------------------------------------
function OpenMenuItem_callback(source, eventdata)
% hObject handle to OpenMenuItem (see GCBO)
% eventdata reserved - to be defined in a future version of MATLAB
% handles structure with handles and user data (see GUIDATA)
file = uigetfile('*.fig');
if ~isequal(file, 0)
open(file);
end
% --------------------------------------------------------------------
function PrintMenuItem_callback(source, eventdata)
% hObject handle to PrintMenuItem (see GCBO)
% eventdata reserved - to be defined in a future version of MATLAB
% handles structure with handles and user data (see GUIDATA)
global c
printdlg(c.f)
% --------------------------------------------------------------------
function CloseMenuItem_callback(source, eventdata)
% hObject handle to CloseMenuItem (see GCBO)
% eventdata reserved - to be defined in a future version of MATLAB
% handles structure with handles and user data (see GUIDATA)
global c
selection = questdlg(['Close ' get(c.f,'Name') '?'],...
['Close ' get(c.f,'Name') '...'],...
'Yes','No','Yes');
if strcmp(selection,'No')
return;
end
delete(c.f)
% --------------------------------------------------------------------
function FileMenu_Callback(source, eventdata)
% hObject handle to FileMenu (see GCBO)
% eventdata reserved - to be defined in a future version of MATLAB
% handles structure with handles and user data (see GUIDATA)
執行結果如下:
以及
當我們將肌電訊號轉換成頻譜(Power spectrum)後,我們的確可
以看到頻率和其強度的分佈,不過這代表什麼意義呢?
我們知道我們的肌肉由不同型態組成,簡單的說可以分為快肌
(fast twitch)跟慢肌(slow twitch),快肌肌肉纖維較粗,動作速
度快,不過較容易疲勞,慢肌動作速度慢,但是可以作用持續時間長,
就傳遞肌肉表面膜電位而言,快肌就像比較粗的電線,傳遞訊號的速度
較快,因此由電極片所接收到單位時間內的電位差訊號相對而言就會比
較多,所以頻率會落在比較高的位置,反觀慢肌,則為相反地現象。
而我們的肌肉,則由不同比例的快慢肌所組成,例如我們強而有力
的肱二頭肌(biceps),快肌的組成較多,所以也比較容易酸。
不過因為頻譜看出來的是各個頻率強度的變化,如果要相互比較的
話,則必須要像一個常態分佈圖形一樣,有平均數(mean),等數值,
比較常用來作為計算的為中位頻率(Median frequency)。
中位頻率(Median frequency),其定義為頻譜分析圖中,將其強
度由低頻積分到高頻,積分面積為全部面積一半時的頻率。因此就可以
中位頻率來作為訓練或是疲勞測試後,改變肌肉組成比例(訓練)或是
影響肌肉放電(疲勞)等改變觀察。
因此利用傅立葉轉換以及if指令來求得中位頻率,當積分到某一點
時,大於全部等積分的一半時的頻率即是中位頻率。
由於肌電訊號是時間性的,我們比較常做的方式會像之前所用的以
window的方式,每多少點計算一次,重複多少點,然而取樣頻率
(sampling rate)會影響最後每一個點所代表的頻率,所以也必須考慮
。
function [med_fq]=fft_i(data,n,op,sr)
% fft for n point
% op: the point of overlapping
% med_fq is the median frequency of the power spectrum
% sr is the sampling frequency
% calculate the times of the loop (-1 due to the initial loop is 0)
l=fix(length(data)/op-1);
fq=(1:n/2).*sr/n; % calculate the frequency of each point
for i = 0:(l-1)
int=1+op*i; % the initial value of the loop
f=fft(data(int:(int+511))); % fft for the data
mag=abs(f); % Amplitude of the fft
mag=mag(1:n/2);
for k=1:n/2
if sum(mag(1:k)) >= sum(mag)/2
med=k;
break
end
end
med_fq(i+1,1)=k*sr/n;
end
% calculate the final part of the sample
int=1+op*l;
f=fft(data(int:end)); % fft for the data
mag=abs(f); % Amplitude of the fft
mag=mag(1:n/2);
for k=1:n/2
if sum(mag(1:k)) >= sum(mag)/2
med=k;
break
end
end
med_fq(l+1,1)=k*sr/n;
首先必須先計算迴圈的次數,以所有的點數除上重複的點數(通常
會以window點數的一半)減一(種樹法則),然後就每多少點作一次傅
立葉轉換並且求得中位頻率,值得注意的是,因為常常所選取的資料數
並不能剛好夠最後一筆,舉例而言,也就是說原本應該要以512個點作計
算,但是迴圈到最後一次時可能只剩下500點,由於fft這個函數當不夠
點的時候會比剩下的點以零帶入,所以最後一個窗口則以另外方式計算
。
執行結果
>> data=textread('D:/EMG_fft.txt');
>> plot(data);
>> med_fq=fft_i(data,512,256,1000);
>> figure(2);plot(med_fq)
這是原始資料圖,資料可以由此下載
經由計算後為
一開始很高可能是因為在還沒有任何訊號時就已經存在的高頻雜訊,
此時就要利用之前提得濾波器給予濾波。
肌電訊號分析可以分為兩個主要部份,一個即是時域
(time domain)另一則是頻域(frequency domain)。
大部分例如方均根植(root mean square)或是找尋
起始點(onset point),是屬於時域的部份;然而頻域的
部份會著重去看頻率和強度之間的關係(power spectrum)
,而以下所介紹的為利用傅立葉轉換(Fourier transform)
所做出的關係圖。
程式如下
data=textread('D:\EMG.txt');
fft_data=fft(data);
mag=abs(fft_data);
fq=(1:length(data)/2).*1200/length(data); % 每一點的所表示的頻率
mag=mag(1:length(data)/2); % 因為另一半為image
plot(fq,mag)
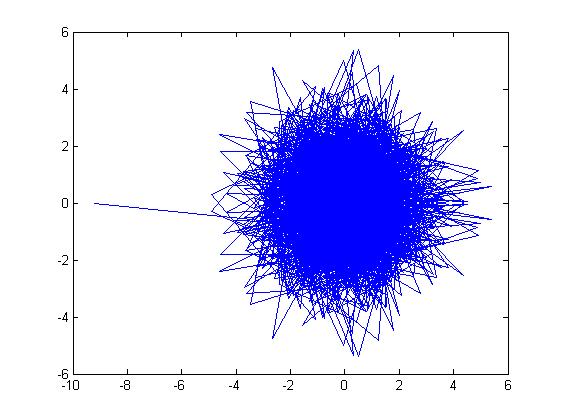
首先可以發現到當對傅立葉轉換後的圖形如下,每個
點都是有相位與長度大小的點。所做出為複數座標系的圖
。
不過對於分析強度和頻率而言,只要去看轉換後每個
點的強度即可,所以將傅立葉轉換後的值取絕對值,即是
強度。
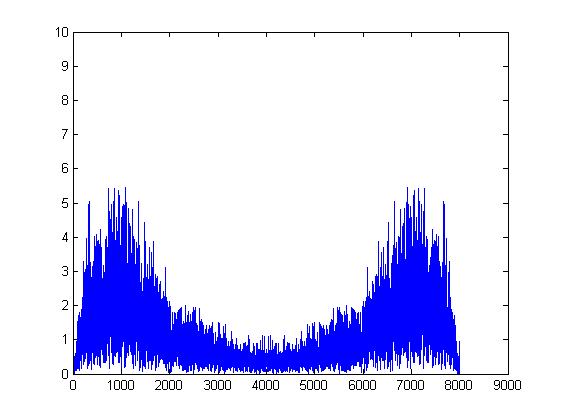
作圖後可以發現到,會是一個以中線分隔兩邊成左右
對稱的圖形也表示只有在一半以下的點是有意義的。
至於為什麼只有一半是有意義而另一半會是跟前一半
對稱鏡射,這是由於我們取樣頻率的關係。
正確的取樣頻率必須至少是原來訊號的兩倍,這就是
所謂的Nyquist rate。即是Nyquist Theorem。
由下圖可以見到,如果取樣頻率較小,原始訊號頻率
很高,所取的訊號圖形和原始訊號就有差距,而變成較低
頻的訊號。
而每一個點所代表的頻率則為”取樣頻率/點數”,
由於只有一半的值是有意義的,所以須將頻率以及強度作
處理,如下:
fq=(1:length(data)/2).*1200/length(data); % 每一點的所表示的頻率
mag=mag(1:length(data)/2); % 因為另一半為image
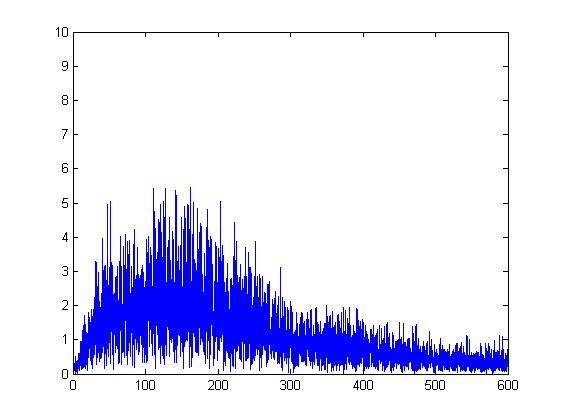
因此做出來的圖形如下
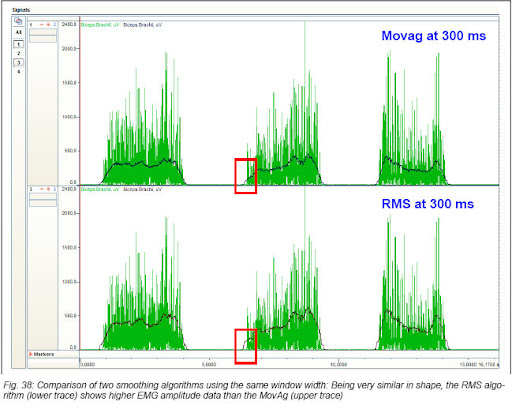
一般我們在分析肌電訊號的時候簡單方式,讓訊號有如封包(envelope)一樣,或是利用這些方式作為分析比較。
常用的有,一階的低通濾波,方均根(rootmean square),或是平均的方式以及積分的方式。然而由於取樣頻率高,因此我們不可能把所選取的範圍全部一次作處理,而會利用窗(window)的方式,其意義是,每次選取特定的點作處理。
依據這樣的概念,利用for loop的方式,也就是每次選取固定的點作為分析使用。
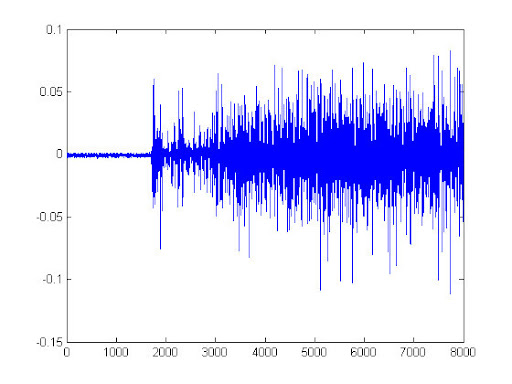
舉例而言,下圖是一段EMG的訊號。
以下是所撰寫的程式碼
function [out point]=moving_avg(data,dur)
l=length(data);
k=menu('Select the function','Average','RMS');
switch k
case 1
for i=1:(length(data)-dur);
out(i,1)=mean(abs(data(i:i+dur,1)));
point(i,1)=(i+i+dur)/2;
end
case 2
for i=1:(length(data)-dur);
out(i,1)=sqrt(sum(data(i:i+dur,1).^2)/dur);
point(i,1)=(i+i+dur)/2;
end
end
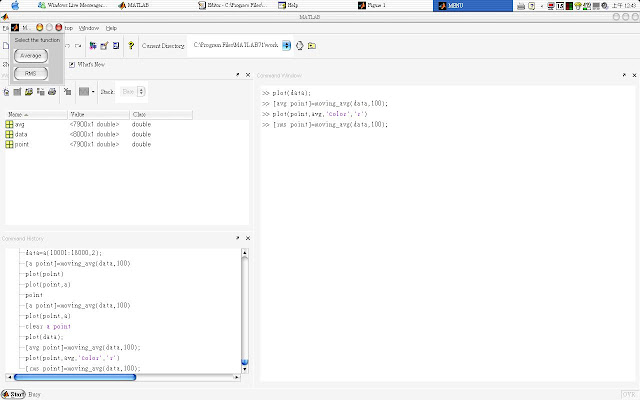
使用的情形如下
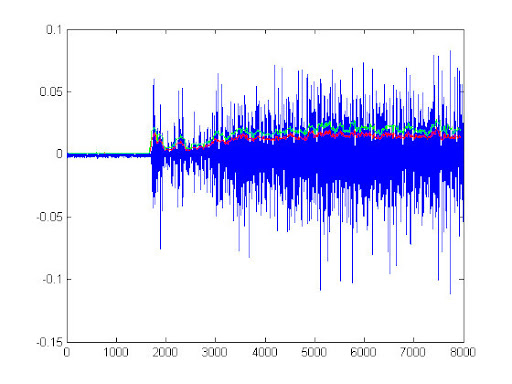
目前以menu方式寫成兩種處理方式。point是說明每一次作處理後點應該落的位置(因為10作完後只有一個點)。
其結果和原始訊號圖畫在一起如下
管路中之損失除管路本身外,其出口、入口及管徑擴張之損失均與動能有關,即V2/(2g)之係數。其程式內容如下
管路配件損頭
經過認養後
或是點此網頁
% pipefittings.m
% Local losses at pipe fittings
%
while 1
k=menu('請輸入接合件之型式','驟然放大','驟然逸出','擴 大 管');
Q=input('請輸入管路流量(m^3/s)[10]: ','s');
if isempty(Q), Q='10';end
D1=input('請輸入入口管徑(m)[1]: ','s');
if isempty(D1), D1='1';end
d1=str2num(D1);
ke=str2num(Q)./(pi*d1.^2/4)/(2*9.81);
switch k
case 1
HL=ke;
case 2
HL=ke/2;
case 3
D2=input('請輸入出口管徑(m)[2]: ','s');
if isempty(D2), D2='2';end
HL=(1-(d1./str2num(D2)).^2).*ke;
end
disp(['此接頭損失為 ' num2str(HL) ' (m).'])
A=input('是否繼續執行(Y/N)[Y]:','s');
if isempty(A), A='Y';end
if upper(A)~='Y', break;end
disp('請由選單選擇轉換單位。。。')
end
管路配件損頭
經過認養後
% pipefittings.m
% Local losses at pipe fittings
%
while 1
k=menu('請輸入接合件之型式','驟然放大','驟然逸出','擴 大 管');
switch k
case 1
prompt = {'請輸入管路流量(m^3/s)[10]','請輸入入口管徑(m)[1]:'};
dlg_title = '您所選擇的是驟然放大';
num_lines = 1;
def = {'10','1'};
answer = inputdlg(prompt,dlg_title,num_lines,def);
Q=answer{1,1};d1=answer{2,1};
ke=Q./(pi*d1.^2/4)/(2*9.81);
HL=ke;
case 2
prompt = {'請輸入管路流量(m^3/s)[10]','請輸入入口管徑(m)[1]:'};
dlg_title = '您所選擇的是驟然逸出';
num_lines = 1;
def = {'10','1'};
answer = inputdlg(prompt,dlg_title,num_lines,def);
Q=answer{1,1};d1=answer{2,1};
ke=Q./(pi*d1.^2/4)/(2*9.81);
HL=ke/2;
case 3
prompt = {'請輸入管路流量(m^3/s)[10]','請輸入入口管徑(m)[1]:','請輸入出口管徑(m)[2]:'};
dlg_title = '您所選擇的是擴大管';
num_lines = 1;
def = {'10','1','2'};
answer = inputdlg(prompt,dlg_title,num_lines,def);
Q=answer{1,1};d1=answer{2,1};d2=answer{3,1};
ke=Q./(pi*d1.^2/4)/(2*9.81);
HL=(1-(d1./d2).^2).*ke;
end
figure('Position',[400 400 400 300],'Name','結果')
uicontrol('style','text','position',[160 200 80 80],'string','此接頭損失為')
uicontrol('style','text','position',[100 90 200 100],'string',HL)
result=questdlg('是否繼續執行?','程式執行詢問','Yes','No','No');
if strcmp(result,'No');
break
end
end
或是點此網頁
plot作圖時
如果新的plot圖時,會將前一次的洗掉,做出第二次的繪圖,舉例如下
第一次plot作圖
如果這時候在使用plot繪製另一個圖形的話,前一次的作圖就會消失
第二次plot作圖
若是要兩個圖顯示在一個figure的話,則必須用hold on指令
以hold on將兩張圖合併
如果要繪製三度空間的圖形的話,則必須要使用plot3的指令
plot3作圖
line作圖
若是以line的指令作圖時,連續使用line繪製不同函數時,則可以不必使用hold on的指令,即可繪製在同一個figure
以line繪製兩個函數
雖然說line可以給予三個變數繪製三度空間的圖,但是實際上使用後會發現繪製仍為2D平面的圖,並且是前面兩個變數的圖型
plot繪製三度空間圖
此時如果要會製成三度空間圖的話,則可以用plot3先繪製一點或是一個三度空間圖形
以plot3繪製三度空間點
最後在重新輸入line的函數,即可再三度空間繪圖
line指令三度空間繪圖
如果新的plot圖時,會將前一次的洗掉,做出第二次的繪圖,舉例如下
第一次plot作圖
如果這時候在使用plot繪製另一個圖形的話,前一次的作圖就會消失
第二次plot作圖
若是要兩個圖顯示在一個figure的話,則必須用hold on指令
以hold on將兩張圖合併
如果要繪製三度空間的圖形的話,則必須要使用plot3的指令
plot3作圖
line作圖
若是以line的指令作圖時,連續使用line繪製不同函數時,則可以不必使用hold on的指令,即可繪製在同一個figure
以line繪製兩個函數
雖然說line可以給予三個變數繪製三度空間的圖,但是實際上使用後會發現繪製仍為2D平面的圖,並且是前面兩個變數的圖型
plot繪製三度空間圖
此時如果要會製成三度空間圖的話,則可以用plot3先繪製一點或是一個三度空間圖形
以plot3繪製三度空間點
最後在重新輸入line的函數,即可再三度空間繪圖
line指令三度空間繪圖
第一題
>> p=[133 0 122 0 0 1] % p=133x^5+122x^3+1
p =
133 0 122 0 0 1
>> q=[2 0 100 0 1] % q=2x^4+100x^2+1
q =
2 0 100 0 1
>> M=conv(p,q)
M =
Columns 1 through 9
266 0 13544 0 12333 2 122 100 0
Column 10
1
>> % p, q 兩多項式的乘積為 266x^9+13544x^7+12333x^5+2x^4+122x^3+100x^2+1
執行結果
第二題
>> p=[100 23 1 45];x=magic(5)
x =
17 24 1 8 15
23 5 7 14 16
4 6 13 20 22
10 12 19 21 3
11 18 25 2 9
以magic(5),x=每個元素帶入f(x)的答案為
>> f=polyval(p,x)
f =
498009 1395717 169 52725 342735
1228935 13125 35479 278967 415549
6817 22479 223645 809265 1075999
102355 176169 694267 936309 2955
135939 590715 1576945 939 74817
執行結果
第三題
>> p=[133 0 122 0 0 1] % p=133x^5+122x^3+1
p =
133 0 122 0 0 1
>> q=[2 0 100 0 1] % q=2x^4+100x^2+1
q =
2 0 100 0 1
>> [s,r]=deconv(p,q)
s =
66.5000 0
r =
1.0e+003 *
0 0 -6.5280 0 -0.0665 0.0010
>> % 商數s=66.5x 餘數r=e^3*(-6.528)x^3+e^3*(-0.0665)x+e^3*(0.001)
執行結果
第四題
>> p=[133 0 122 0 0 1] % p=133x^5+122x^3+1
p =
133 0 122 0 0 1
>> roots(p)
ans =
-0.0045 + 0.9578i
-0.0045 - 0.9578i
0.1039 + 0.1744i
0.1039 - 0.1744i
-0.1988
>> q=[2 0 100 0 1] % q=2x^4+100x^2+1
q =
2 0 100 0 1
>> roots(q)
ans =
0 + 7.0704i
0 - 7.0704i
0 + 0.1000i
0 - 0.1000i
執行結果
第五題
>> x=[1:9]; y=[1210, 1866, 2301, 2564, 2724, 2881, 2879, 2915, 3010];
>> p=polyfit(x,y,3)
p =
6.3047 -134.4603 994.3540 350.9127
>> f=@(a) (6.3047*a^3-134.4603*a^2+994.354*a+350.9127)
f =
@(a) (6.3047*a^3-134.4603*a^2+994.354*a+350.9127)
>> fplot(f,x)
>> hold on
>> plot(x,y)
>>
此題執行後,其polyfit的結果似乎只有x=1~2的時候比較符合,因為不管我限制多少範圍
做出來的圖x座標都是從1~2
然後將其和原圖放在一起
執行結果
>> p=[133 0 122 0 0 1] % p=133x^5+122x^3+1
p =
133 0 122 0 0 1
>> q=[2 0 100 0 1] % q=2x^4+100x^2+1
q =
2 0 100 0 1
>> M=conv(p,q)
M =
Columns 1 through 9
266 0 13544 0 12333 2 122 100 0
Column 10
1
>> % p, q 兩多項式的乘積為 266x^9+13544x^7+12333x^5+2x^4+122x^3+100x^2+1
執行結果
第二題
>> p=[100 23 1 45];x=magic(5)
x =
17 24 1 8 15
23 5 7 14 16
4 6 13 20 22
10 12 19 21 3
11 18 25 2 9
以magic(5),x=每個元素帶入f(x)的答案為
>> f=polyval(p,x)
f =
498009 1395717 169 52725 342735
1228935 13125 35479 278967 415549
6817 22479 223645 809265 1075999
102355 176169 694267 936309 2955
135939 590715 1576945 939 74817
執行結果
第三題
>> p=[133 0 122 0 0 1] % p=133x^5+122x^3+1
p =
133 0 122 0 0 1
>> q=[2 0 100 0 1] % q=2x^4+100x^2+1
q =
2 0 100 0 1
>> [s,r]=deconv(p,q)
s =
66.5000 0
r =
1.0e+003 *
0 0 -6.5280 0 -0.0665 0.0010
>> % 商數s=66.5x 餘數r=e^3*(-6.528)x^3+e^3*(-0.0665)x+e^3*(0.001)
執行結果
第四題
>> p=[133 0 122 0 0 1] % p=133x^5+122x^3+1
p =
133 0 122 0 0 1
>> roots(p)
ans =
-0.0045 + 0.9578i
-0.0045 - 0.9578i
0.1039 + 0.1744i
0.1039 - 0.1744i
-0.1988
>> q=[2 0 100 0 1] % q=2x^4+100x^2+1
q =
2 0 100 0 1
>> roots(q)
ans =
0 + 7.0704i
0 - 7.0704i
0 + 0.1000i
0 - 0.1000i
執行結果
第五題
>> x=[1:9]; y=[1210, 1866, 2301, 2564, 2724, 2881, 2879, 2915, 3010];
>> p=polyfit(x,y,3)
p =
6.3047 -134.4603 994.3540 350.9127
>> f=@(a) (6.3047*a^3-134.4603*a^2+994.354*a+350.9127)
f =
@(a) (6.3047*a^3-134.4603*a^2+994.354*a+350.9127)
>> fplot(f,x)
>> hold on
>> plot(x,y)
>>
此題執行後,其polyfit的結果似乎只有x=1~2的時候比較符合,因為不管我限制多少範圍
做出來的圖x座標都是從1~2
然後將其和原圖放在一起
執行結果
第一題
利用struct的方式撰寫
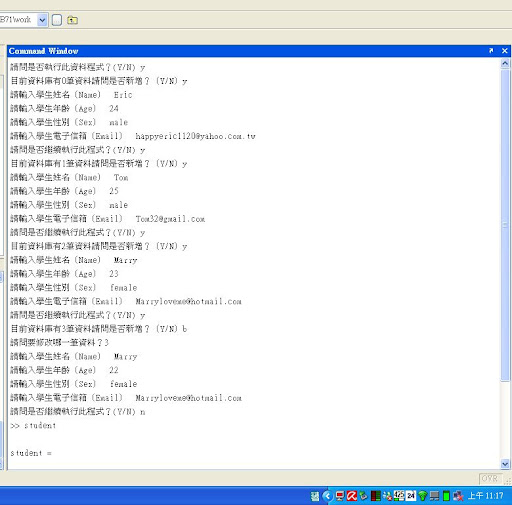
執行結果1
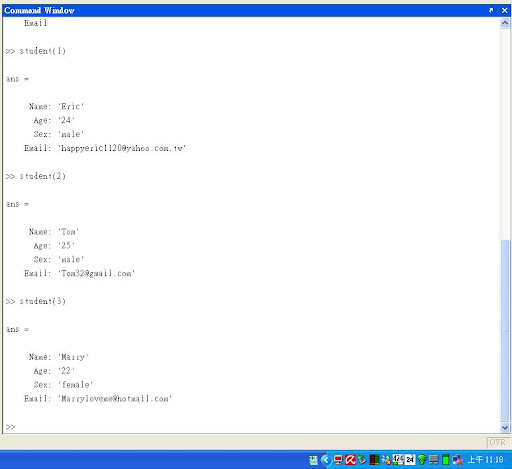
執行結果2
第二題
利用Menu和Switch的方式撰寫
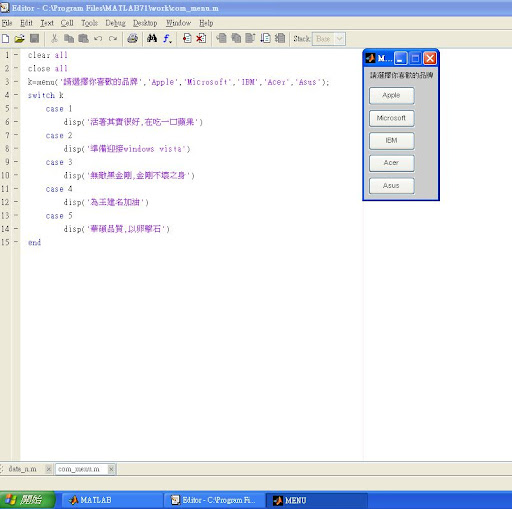
程式執行圖
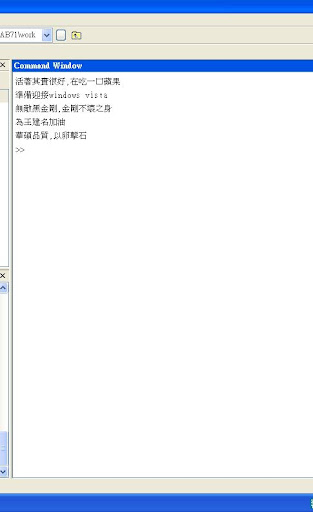
執行結果圖
第四題
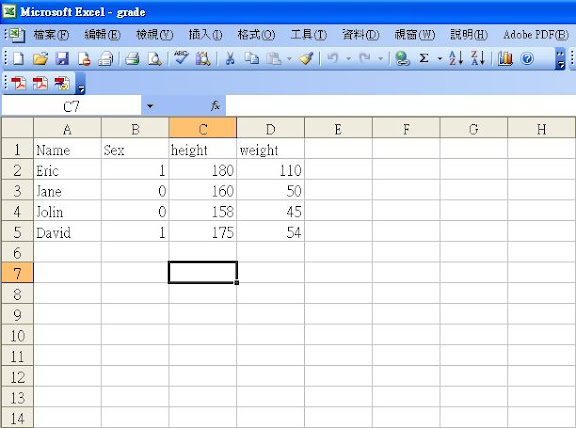
原始資料檔案
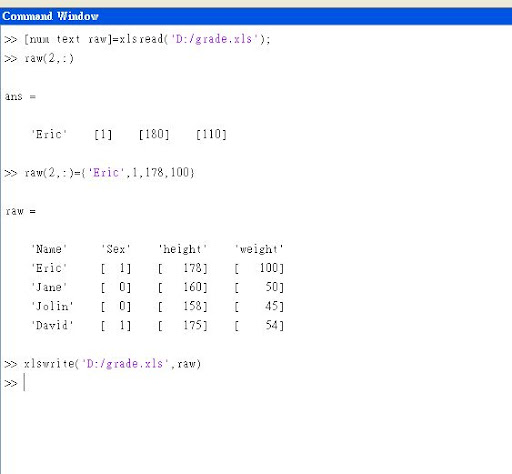
在command window下利用xlsread和xlswrite的方式修改資料
>> [num text raw]=xlsread('D:/grade.xls');
>> raw(2,:)
ans =
'Eric' [1] [180] [110]
>> raw(2,:)={'Eric',1,178,100}
raw =
'Name' 'Sex' 'height' 'weight'
'Eric' [ 1] [ 178] [ 100]
'Jane' [ 0] [ 160] [ 50]
'Jolin' [ 0] [ 158] [ 45]
'David' [ 1] [ 175] [ 54]
>> xlswrite('D:\grade.xls',raw)
程式執行圖
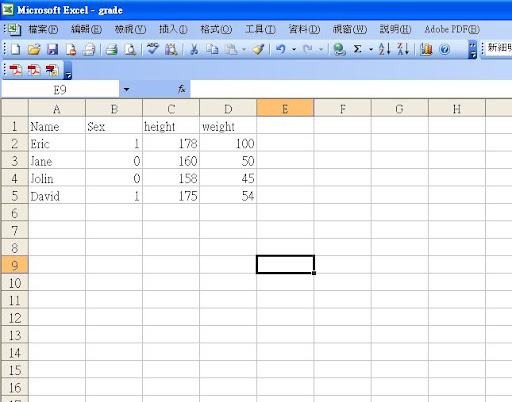
執行結果圖
確實在exel裡面修改了資料
利用struct的方式撰寫
% student為整個struct的名稱 % 利用while的方式讓整個程式可以執行
student=struct('Name',0,'Age',0,'Sex',0,'Email',0);
ans='Y';
h=input('請問是否執行此資料程式?(Y/N) ', 's');
j=strcmp(upper(h),ans);
while j==1
if student(1).Name==0 %先判斷是否已經有存在資料庫
i=0;
else i=length(student);
end
fprintf('目前資料庫有%d筆資料',i);
e=input('請問是否新增?(Y/N)','s');
f=strcmp(upper(e),ans);
if f==0 %判別起始回答時是否因為尚未建立而要去修改
if i==0
disp('目前資料庫裡面沒有資料,請新增')
else
g=input('請問要修改哪一筆資料?');
i=g;
end
a=input('請輸入學生姓名(Name) ','s');
b=input('請輸入學生年齡(Age) ','s');
c=input('請輸入學生性別(Sex) ','s');
d=input('請輸入學生電子信箱(Email) ','s');
student(i)=struct('Name',{a},'Age',{b},'Sex',{c},'Email',{d});
elseif f==1
i=i+1;
a=input('請輸入學生姓名(Name) ','s');
b=input('請輸入學生年齡(Age) ','s');
c=input('請輸入學生性別(Sex) ','s');
d=input('請輸入學生電子信箱(Email) ','s');
student(i)=struct('Name',{a},'Age',{b},'Sex',{c},'Email',{d});
end
h=input('請問是否繼續執行此程式?(Y/N) ', 's');
j=strcmp(upper(h),ans); %決定是否要在繼續增加或修改資料
end
執行結果1
執行結果2
第二題
利用Menu和Switch的方式撰寫
clear all
close all
k=menu('請選擇你喜歡的品牌','Apple','Microsoft','IBM','Acer','Asus');
switch k
case 1
disp('活著其實很好,在吃一口蘋果')
case 2
disp('準備迎接windows vista')
case 3
disp('無敵黑金剛,金剛不壞之身')
case 4
disp('為王建名加油')
case 5
disp('華碩品質,以卵擊石')
end
程式執行圖
執行結果圖
第四題
原始資料檔案
在command window下利用xlsread和xlswrite的方式修改資料
>> [num text raw]=xlsread('D:/grade.xls');
>> raw(2,:)
ans =
'Eric' [1] [180] [110]
>> raw(2,:)={'Eric',1,178,100}
raw =
'Name' 'Sex' 'height' 'weight'
'Eric' [ 1] [ 178] [ 100]
'Jane' [ 0] [ 160] [ 50]
'Jolin' [ 0] [ 158] [ 45]
'David' [ 1] [ 175] [ 54]
>> xlswrite('D:\grade.xls',raw)
程式執行圖
執行結果圖
確實在exel裡面修改了資料
訂閱:
文章 (Atom)